
A Datadog dashboard full of green metrics does not mean your AI system is working. It means your AI system is responding. An LLM can return a 200 OK with sub-second latency while confidently hallucinating a company policy that does not exist, citing a document it never read, or generating a financial recommendation based on data it misinterpreted. Traditional monitoring will report all of that as a successful request because it was never designed to evaluate whether a response is correct, only whether the infrastructure delivered one.
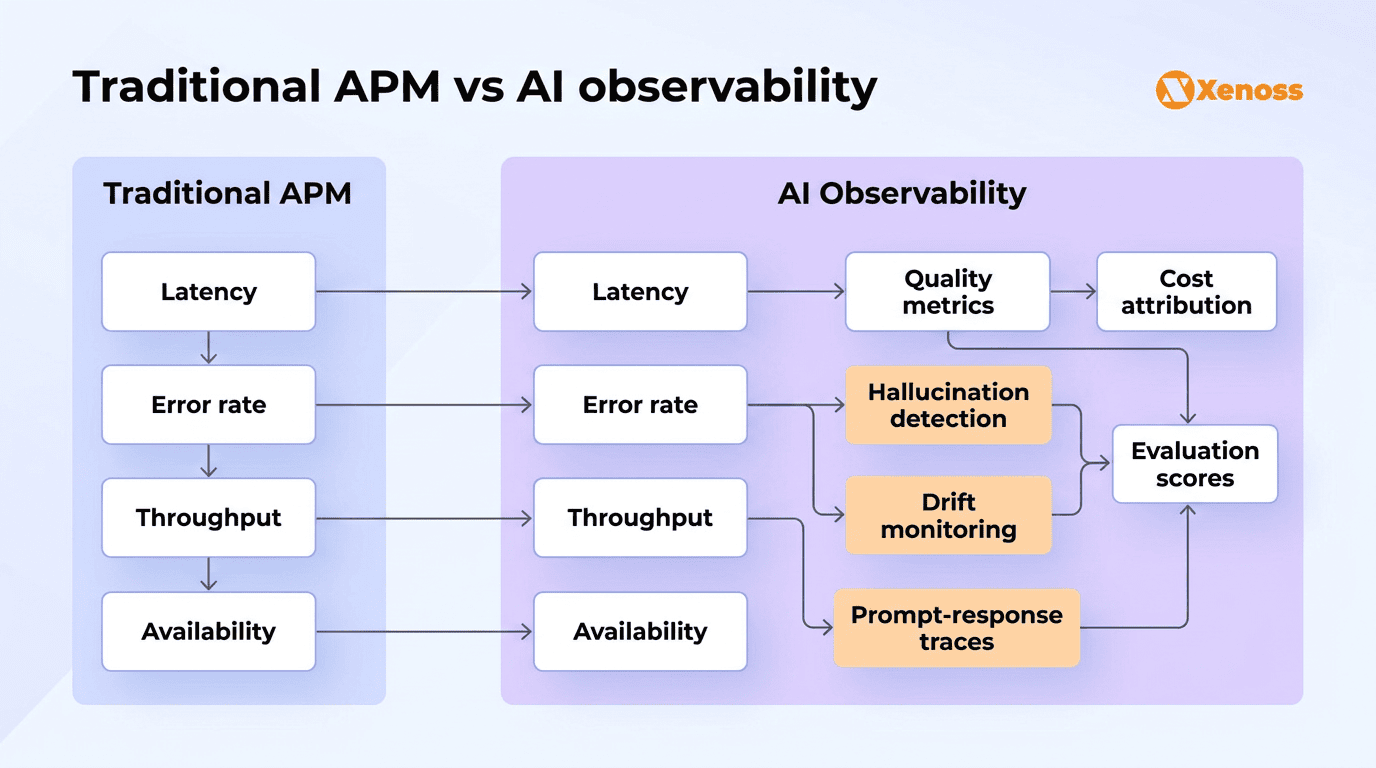
That disconnect is what AI observability exists to solve. Traditional application performance monitoring tells you whether your system is up, fast, and returning responses, which is necessary but insufficient when the system in question generates natural language.
AI observability goes further: it evaluates whether those responses are accurate, tracks what each one costs in tokens and compute, and watches for quality degradation over time. The Elastic 2026 Observability Landscape report, surveying over 500 IT decision-makers, found that 85% of organizations are already using GenAI for observability, and 85% plan to implement dedicated LLM observability. The LLM observability market hit an estimated $2.69 billion this year and is projected to reach $9.26 billion by 2030.
This article covers what AI observability involves in practice, the metrics that matter for production LLM and agent systems, how OpenTelemetry’s GenAI semantic conventions are becoming the standard, and where off-the-shelf tools stop and custom MLOps engineering starts.
Summary
- AI observability goes beyond traditional monitoring by evaluating the quality, cost, and correctness of LLM and AI agent outputs.
- LLM observability tracks token usage, cost per request, prompt-response traces, latency, hallucination frequency, and output drift across model versions and providers.
- AI agent observability adds multi-step workflow tracing: which tools an agent called, what parameters it used, how sub-agents coordinated, and where in the reasoning chain errors originated.
- OpenTelemetry GenAI semantic conventions are becoming the industry standard. Datadog, Grafana, and Arize Phoenix already support them natively. The conventions define standard attributes for LLM calls, agent invocations, and tool executions.
What is AI observability?
It covers three signal types that traditional monitoring does not address:
- traces (the full execution path of an LLM call or agent workflow, including every tool invocation and reasoning step),
- quality metrics (whether the output is accurate, relevant, and consistent),
- and evaluations (automated and human assessments of output quality over time).
APM answers: “Is the system up? Is it fast? Are requests succeeding?”
AI observability answers: “Is the system producing correct outputs? Are those outputs getting worse over time? How much is each useful response costing?”
An LLM can return a 200 OK with sub-second latency while confidently hallucinating. Traditional monitoring will never catch that. AI observability will.
The need has moved from theoretical to budgeted. Gartner projects that by 2028, LLM observability investments will account for 50% of GenAI deployments, up from roughly 15% in early 2026. AI capabilities are now the number one criterion (29%) for choosing an observability platform.
LLM observability: What to track and why
LLM observability focuses on the individual model call: what went in, what came out, how long it took, what it cost, and whether the output was any good. Five categories of telemetry cover the essentials.
Token usage and cost attribution. LLMs are billed per token, and cost varies dramatically by model and provider. Tracking input tokens, output tokens, and the associated cost per request is the foundation of LLM economics. Without token-level attribution, teams discover their monthly inference bill is 3x the estimate with no way to identify which features or users are driving the spend. Cost-per-successful-completion (excluding retries, errors, and hallucinated outputs) is a more useful metric than raw cost-per-request.
Prompt-response tracing. Every LLM call should be traceable: the system prompt, user prompt, any retrieved context (RAG), the model’s response, and the finish reason. This trace is the starting point for debugging bad outputs. When a user reports a wrong answer, the trace shows exactly what the model saw and what it generated. OpenTelemetry’s GenAI semantic conventions standardize this as opt-in content capture (since prompts often contain sensitive data).
Latency breakdown. End-to-end latency is useful but insufficient. Breaking it into time-to-first-token (TTFT), tokens-per-second throughput, and network latency separates model performance from infrastructure bottlenecks. A slow response might be the model (high TTFT), the network (high RTT to the inference endpoint), or the application (slow context retrieval before the LLM call). Without the breakdown, you are guessing.
Model version and provider tracking. Teams often run multiple model versions (for A/B testing or gradual rollouts) and multiple providers (for failover or cost optimization). Observability must tag every trace with the specific model version and provider, so quality and cost metrics can be compared per-model. When GPT-4o-mini starts producing lower-quality outputs after a provider update, the degradation needs to be visible in the model-specific metrics, not buried in an aggregate.
Output quality signals. This is where AI observability diverges furthest from traditional monitoring. Quality metrics include hallucination frequency (how often the model generates unsupported claims), factual accuracy scores (validated against ground truth or retrieved context), response relevance (does the output address the user’s intent), and consistency (does the model give similar answers to similar questions). These signals typically come from automated evaluators (LLM-as-judge patterns, semantic similarity scores) and human annotation workflows.
AI agent observability: Beyond simple LLM calls
An LLM call is a single request-response pair. An AI agent is a multi-step workflow where the LLM decides what to do next, calls tools, processes results, and chains actions together. Monitoring an agent requires tracing the entire execution graph, not just individual model calls.
89% of organizations have implemented some form of observability for AI agents. But “some form” covers a wide range, from basic logging to full distributed tracing. The OpenTelemetry GenAI community is actively defining the standard for agent-level telemetry, and the conventions already cover four critical span types.
Agent lifecycle spans. The top-level span for an agent invocation (invoke_agent) captures the full execution from request to final response, including all intermediate steps. A nested create_agent span records agent initialization. These spans provide the parent context for all downstream LLM calls and tool invocations, creating a single trace tree for the entire agent workflow.
Tool execution tracing. Every tool call an agent makes (database queries, API calls, file reads, MCP server invocations) gets its own execute_tool span with the tool name, parameters, and result. This is where most agent failures originate: a tool returns unexpected data, the agent misinterprets the result, or a tool call times out silently. Without tool-level tracing, debugging agent failures means reading logs and guessing which tool went wrong.
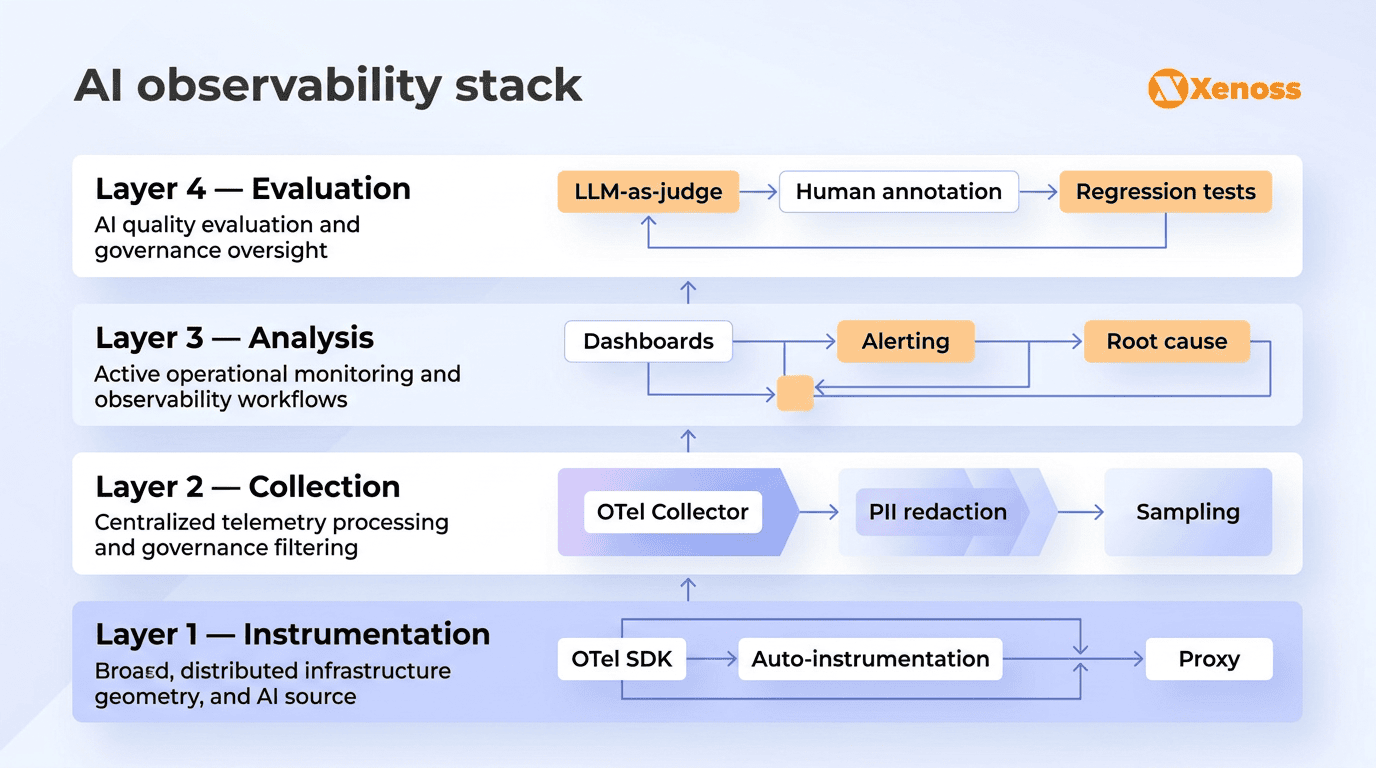
Multi-step reasoning visibility. Agents often chain multiple LLM calls with tool calls in between. The execution path is not linear: the agent might call a tool, evaluate the result, decide it needs more information, call a different tool, and then synthesize a final response. Observability must capture this decision graph, not just a flat list of calls. OpenTelemetry’s nested span model handles this naturally: each LLM call and tool invocation is a child span of the parent agent span, preserving the execution hierarchy.
Token economics across the workflow. A single agent request might trigger 5 LLM calls and 8 tool invocations. The total token cost is the sum across all calls, but the cost-per-useful-output is what matters for business decisions. If an agent spends 90% of its tokens on intermediate reasoning steps that could be replaced by a simpler tool call, that shows up in agent-level cost attribution but not in per-call metrics.
OpenTelemetry GenAI semantic conventions: The emerging standard
OpenTelemetry is becoming the standard instrumentation layer for AI observability. The GenAI Semantic Conventions SIG (Special Interest Group), defines standardized attribute names, span types, and metric definitions for AI workloads. As of early 2026, most conventions are stabilizing, and major vendors have started building native support.
Core attributes. Every LLM call span includes: gen_ai.request.model (which model was called), gen_ai.usage.input_tokens and gen_ai.usage.output_tokens (token consumption), gen_ai.response.finish_reasons (why the model stopped generating), and gen_ai.operation.name (chat, text_completion, embeddings). Span names follow the pattern {operation.name} {gen_ai.system}, making traces human-readable: “chat openai” or “chat anthropic.”
Content capture is opt-in. By default, prompts and completions are not captured because they often contain PII or sensitive data. Enabling content capture (via OTEL_INSTRUMENTATION_GENAI_CAPTURE_MESSAGE_CONTENT) populates attributes with full prompt messages, system prompts, tool schemas, tool arguments, and tool results. This is essential for debugging but requires PII redaction at the collector level in production environments.
Agent-specific spans. The conventions define invoke_agent for the top-level agent invocation, create_agent for initialization, and execute_tool for tool calls. The OpenTelemetry GenAI SIG is actively developing conventions for multi-agent systems, covering tasks, actions, agent teams, memory, and artifact tracking.
Vendor adoption. Datadog added native support for OTel GenAI Semantic Conventions starting with v1.37 of the OTel SDK. Grafana collects LLM traces in Loki. Arize Phoenix, Langfuse, and Jaeger v2 all support the conventions. The practical implication: if you instrument with OpenTelemetry once, your traces work across any of these backends without code changes. Vendor lock-in drops significantly.
Why this matters: Before OTel GenAI conventions, every observability vendor defined its own schema for LLM telemetry. Switching from Langfuse to Datadog meant re-instrumenting your code. The conventions make instrumentation portable: instrument once, export to any backend. For teams building production AI systems, this is the right foundation to build on.
AI observability tools and LLM observability platforms
The tooling landscape breaks into four categories, each serving different team profiles and maturity levels.
Open-source tracing platforms. Langfuse (MIT-licensed, self-hostable) and Arize Phoenix provide LLM tracing, prompt management, and evaluation hooks without licensing cost. Langfuse has strong community adoption and supports custom scoring attached to traces. Phoenix focuses on embeddings analysis and drift detection. These tools work well for teams that want full control over data residency and are comfortable managing infrastructure.
Enterprise APM platforms with GenAI support. Datadog, Dynatrace, New Relic, and Grafana have all added LLM observability to their existing platforms. The advantage is unified visibility: LLM traces appear alongside application traces, infrastructure metrics, and logs in the same dashboard. The Elastic 2026 survey found that integrated GenAI capabilities are now a primary criterion for platform selection. The trade-off is cost (enterprise pricing) and the fact that GenAI features are still maturing relative to the platform’s core APM capabilities.
Evaluation-first platforms. Confident AI, Maxim AI, and Braintrust treat quality evaluation as the core capability rather than an add-on to tracing. These platforms offer automated evaluators (hallucination detection, factual accuracy scoring, response relevance), regression testing, and workflows that pull product and domain experts into the evaluation loop. For teams where output quality is the primary concern (customer-facing agents, compliance-sensitive applications), evaluation-first platforms provide deeper quality signals than tracing platforms with evaluation bolted on.
Gateway-based observability. Helicone and Portkey route LLM traffic through a proxy that captures telemetry without modifying application code. This is the fastest path to basic observability: add a proxy URL, and every LLM call is automatically logged with latency, token usage, and cost metrics. The limitation is visibility depth: gateway-based tools see the LLM call but not the application context around it (which user triggered the request, what RAG context was retrieved, what the agent did with the response).
Connecting AI observability to governance and compliance
Observability generates the telemetry that governance frameworks enforce. Without observability, governance is a set of policies with no verification mechanism. Two connections are particularly valuable for regulated enterprises.
Audit trails for EU AI Act and GDPR compliance. The EU AI Act requires documented traceability for high-risk AI systems. Observability traces (which data went into the model, what prompt was used, what the model returned, what action was taken) provide the raw material for these audit trails. When a regulator asks “how did your system reach this decision for this customer?”, the observability trace plus the data lineage from training data to model version provide a complete answer.
Shadow AI detection through telemetry. Network-level observability can detect shadow AI usage: outbound API calls to inference endpoints (api.openai.com, api.anthropic.com) that were not configured by the engineering team. Telemetry from agent platforms can surface agents created through low-code tools that were never registered in the agent registry. Observability is the detection layer that makes shadow AI governance enforceable.
Where off-the-shelf observability needs custom engineering
Platform tools cover standard LLM calls and common agent frameworks (LangChain, CrewAI, AutoGen). They leave gaps in three enterprise scenarios.
Custom ML pipelines. Teams running proprietary models, custom fine-tuned models, or inference pipelines outside managed platforms (not using SageMaker, Vertex AI, or Azure ML) need custom instrumentation to emit OTel GenAI spans. The OpenTelemetry SDK provides the building blocks, but wiring them into a custom inference pipeline requires engineering work specific to each architecture.
Industrial and IoT agent workflows. AI agents connected to SCADA systems, sensor networks, or industrial control systems generate telemetry that no off-the-shelf observability tool understands. The latency profile (milliseconds matter for real-time control), the data format (proprietary sensor protocols), and the failure modes (equipment safety, not just user experience) all require custom observability pipelines built for the specific industrial environment.
Multi-provider orchestration. Enterprise AI systems increasingly route requests across multiple model providers (OpenAI, Anthropic, Google, self-hosted) based on cost, latency, or capability requirements. Observing this routing layer, including failover events, provider-level quality comparisons, and cost optimization effectiveness, requires custom instrumentation that connects the orchestration logic to the observability backend.
Bottom line
Traditional monitoring tells you if your AI system is running. AI observability tells you if it is running well. The distinction matters because an LLM can return fast, successful responses that are completely wrong, and traditional APM will never catch it.
OpenTelemetry GenAI semantic conventions provide a vendor-neutral instrumentation standard. Major platforms (Datadog, Dynatrace, Grafana) support them natively. Open-source tools (Langfuse, Arize Phoenix) offer full-featured alternatives for teams that prefer self-hosting. The LLM observability market is approaching $3 billion and the investment trajectory is clear.
For teams deploying LLMs in production, the minimum viable observability stack includes token cost attribution, prompt-response tracing, latency breakdowns, and at least one automated quality metric (hallucination detection or factual accuracy scoring). For teams deploying AI agents, add tool execution tracing, agent lifecycle spans, and multi-step workflow visibility. For regulated industries, connect observability traces to data lineage and AI governance frameworks to create audit-ready documentation.
FAQ
What is the difference between LLM observability and AI agent observability?
LLM observability focuses on individual model calls: what prompt went in, what response came out, how many tokens were used, how long it took, and whether the output was correct. AI agent observability extends this to multi-step workflows where an LLM orchestrates tool calls, processes results, and chains actions together. Agent observability tracks the full execution graph (agent lifecycle spans, tool invocations, reasoning chains) rather than isolated model calls. The key addition is understanding why an agent chose a specific tool, what happened when it called it, and how intermediate results influenced the final output.
What are the best AI observability tools?
The leading tools fall into four categories. Open-source tracing: Langfuse (MIT, self-hostable, strong community) and Arize Phoenix (embeddings analysis, drift detection). Enterprise APM: Datadog LLM Observability, Dynatrace, New Relic, and Grafana, all with native OpenTelemetry GenAI support. Evaluation-first: Confident AI, Maxim AI, and Braintrust (automated quality scoring, regression testing). Gateway-based: Helicone and Portkey (proxy-based, zero-code instrumentation). The right choice depends on whether your priority is tracing depth, quality evaluation, integration with existing APM, or speed of deployment.
What are OpenTelemetry GenAI semantic conventions?
OpenTelemetry GenAI semantic conventions are a standardized schema for recording telemetry from AI systems. Developed by the GenAI SIG (Special Interest Group) within the OpenTelemetry community, they define attribute names, span types, and metrics for LLM calls (model name, token usage, finish reasons), agent invocations (create_agent, invoke_agent), and tool executions (execute_tool). Major vendors including Datadog, Grafana, and Arize Phoenix support these conventions natively, meaning teams can instrument once with OpenTelemetry and export traces to any compatible backend without re-instrumentation. Content capture (prompts and completions) is opt-in to protect sensitive data.