Oil and gas companies rely on flow meters to measure the volume and composition of hydrocarbons transported through pipelines. Traditional multiphase flow meters (MPFMs) cost $500K+ to install and maintain, require frequent calibration, and lose accuracy at high water-cut ratios. These limitations drive operational costs and limit scalability across well portfolios.
Virtual Flow Metering (VFM) solves these challenges by using machine learning algorithms to estimate flow rates from existing sensor data—pressure, temperature, and pipeline conditions. This approach delivers real-time monitoring, reduces operational costs by 60-80%, and enables predictive maintenance.
This article explores how to architect hybrid VFM systems that combine ML predictions with physics-based modeling for maximum accuracy and reliability.
Virtual flow meter benefits: Overcoming MPFM limitations
The shift from single-phase to multiphase flow meters (MPFMs) in the 1980s revolutionized well monitoring by enabling individual well output tracking.
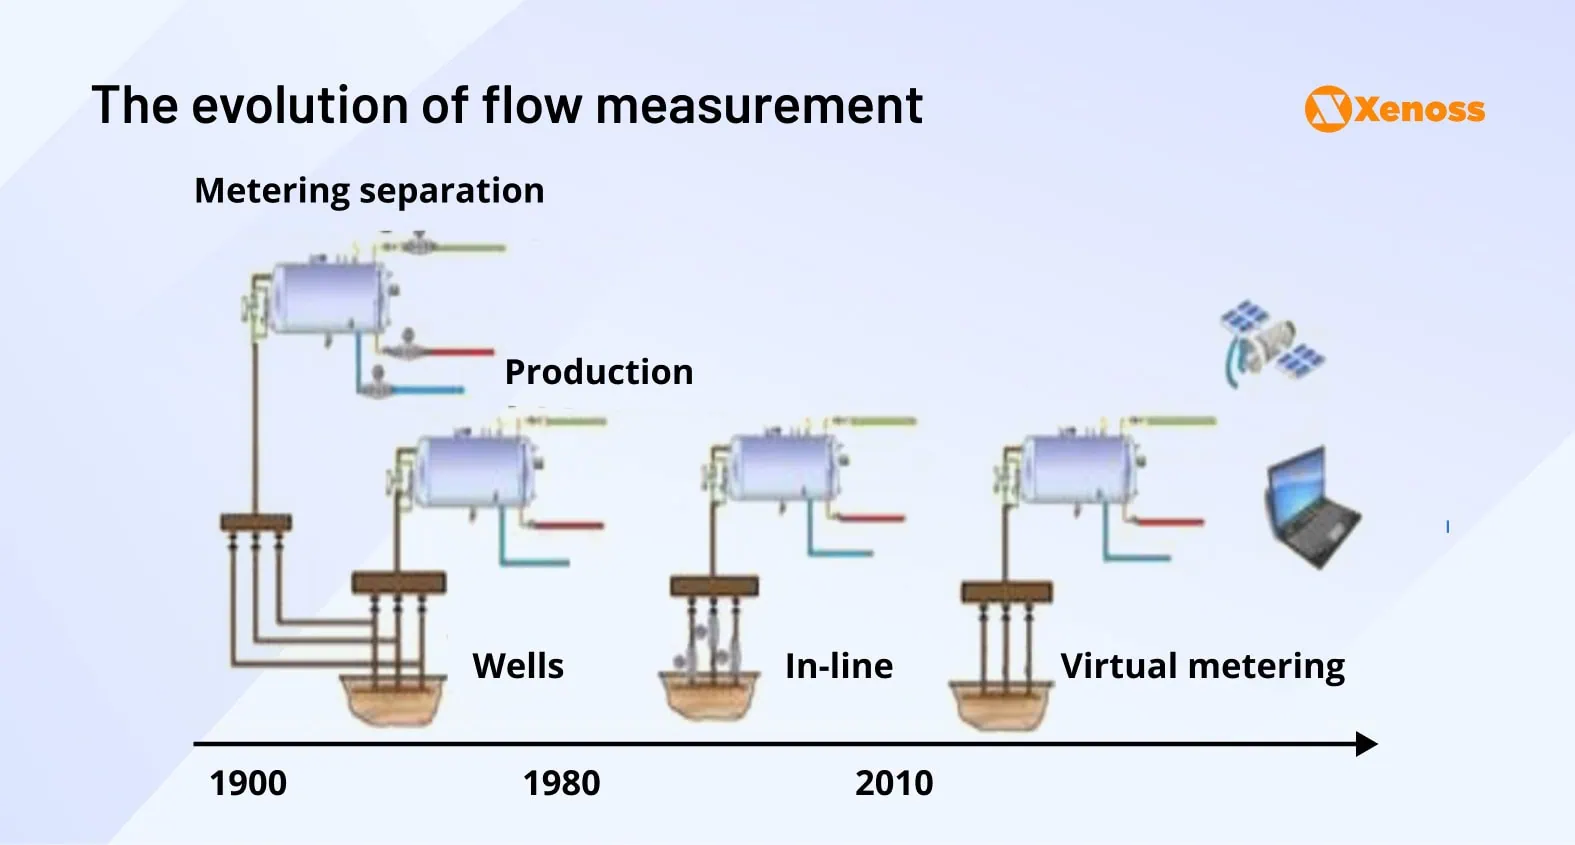
Despite remaining the industry gold standard, MPFMs face critical operational challenges:
- High costs: Expensive installation, repair, and regular calibration drive the low adoption rate
- Accuracy issues: MPFM measurements lose precision at high water-liquid ratios and gas-volume fractions. 90% of flow meters show statistically significant errors at high GVFs
- Environmental sensitivity: Reliability plummets when installed near wax, scale, or asphaltene deposits
Energy companies needed a cheaper and more accurate alternative, which led to the rise of virtual flow meter development in the last decade.
A virtual flow meter is a real-time software, built with a combination of hydraulic and machine learning models to calculate how much oil, gas, or water flows through a well.
A VFM helps operators monitor flow rates 24/7 across every well and pipeline. Teams then use this data to optimize operations and react to on-site changes immediately.
Engineering-wise, virtual flow meters improve upon the shortcomings of MPFMs.
- VFM models are cheaper to install, maintain, and operate.
- The accuracy of predictions is not sensitive to the presence of wax, scale, or asphaltenes.
- Lower cost-per-meter increases the scalability of flow measurement and offers more accurate insights across large well groups.
As IoT and machine learning techniques grow more advanced, so do virtual flow meters.
Christine Foss-Sjulstad, a data scientist at Solution Seeker, an AI platform for real-time well testing and monitoring, notes that VFMs are improving at “contextualizing the data and triggering algorithms in a correct way.”
However, most operators still deploy VFMs alongside MPFMs rather than as standalone solutions. The limitation lies in traditional machine learning models’ inability to accurately capture real-world fluid dynamics—they struggle with complex reservoir parameters, fluid properties, and thermodynamic constraints that govern actual flow behavior.
This gap between ML pattern recognition and physical reality drives the need for hybrid approaches that integrate physics-based modeling with data-driven algorithms.
Integrating physics-based models with ML for accurate flow prediction
The ideal virtual flow meter seamlessly integrates machine learning algorithms with fluid mechanics equations to deliver accurate predictions across diverse operating conditions.
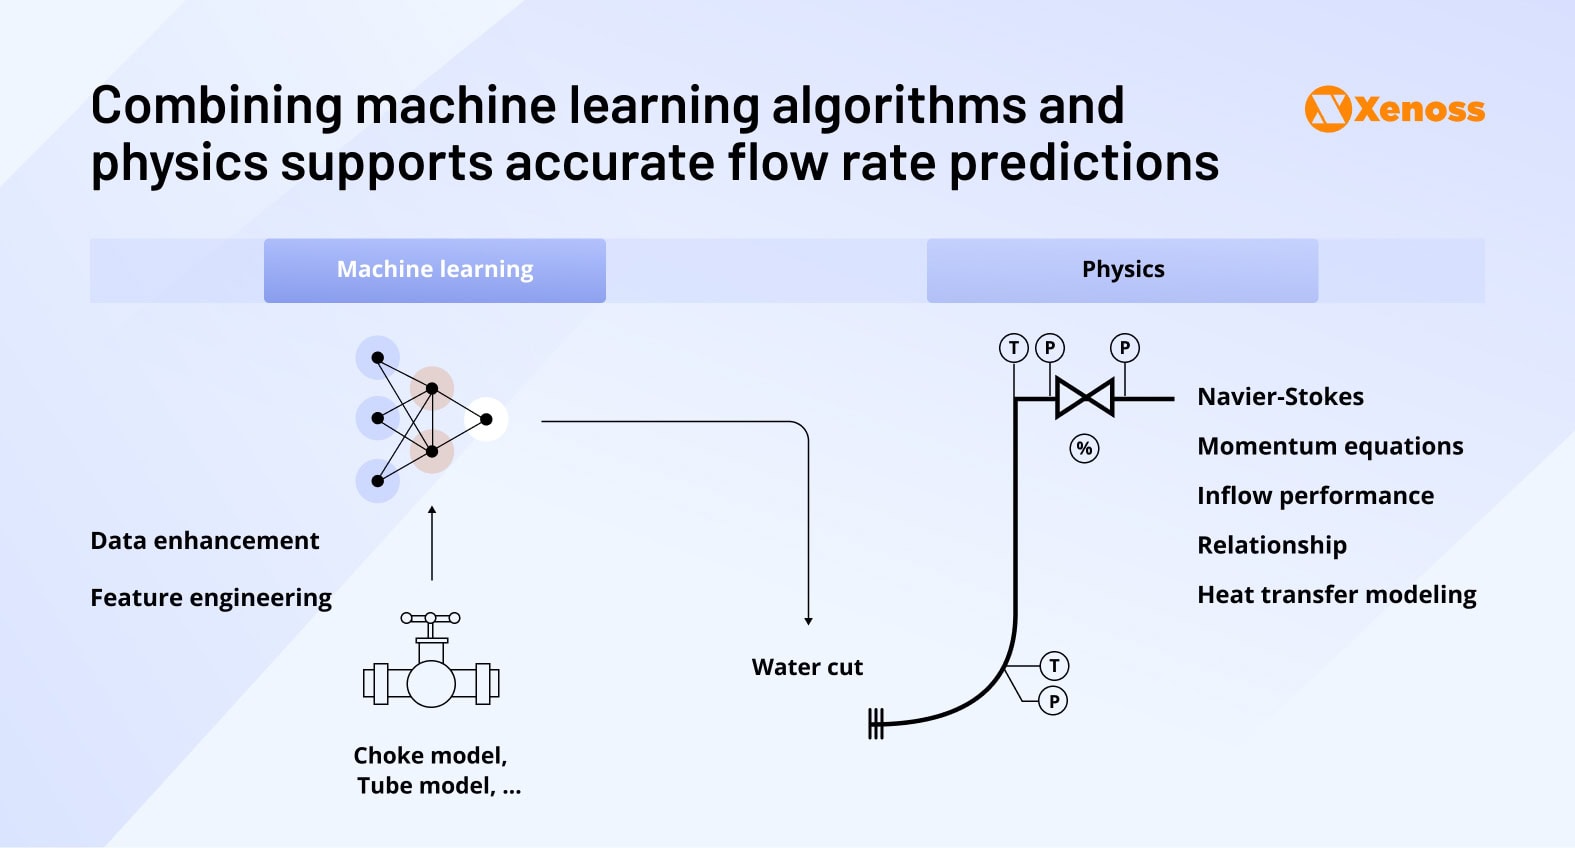
However, combining ML with first-principles physics presents well-documented challenges in the AI community. Lilian Weng, co-founder of Thinking Machines Lab, notes that reinforcement learning models trained on theoretical simulator data often fail to match real-world constraints.
In fluid mechanics, this manifests as domain gaps between simulated and actual conditions:
- Density and viscosity variations under operational pressure-temperature ranges
- Free gas content fluctuations affecting multiphase flow patterns
- Water cut and emulsion behavior changes over the well lifecycle
Successfully bridging this gap requires “gray-box engineering”—deep expertise in both fluid dynamics and machine learning architectures.
When Xenoss engineers developed a scalable VFM solution for a leading US oil & gas operator, we addressed these challenges through hybrid modeling that leverages physics constraints to guide ML predictions while using data-driven approaches to capture complex operational nuances.
The following sections outline the architectural, scientific, and engineering considerations that enabled the successful integration of physics and machine learning (ML).
Hybrid VFM architecture: Integrating physics and ML models
Building a hybrid virtual flow meter requires architectural decisions that balance real-time performance, accuracy, and operational scalability. Below are the core considerations and components for integrating fluid mechanics with machine learning algorithms.
VFM deployment scenarios
Energy companies deploy hybrid VFMs in three primary operational modes:
- Backup monitoring: Continuous 24/7 flow estimation when hardware MPFMs fail or undergo maintenance
- Validation and reconciliation: Cross-checking proprietary or third-party MPFM measurements for data quality assurance
- Primary measurement: Cost-effective alternative to traditional MPFMs for wells where installation economics don’t justify hardware meters
Core architecture components
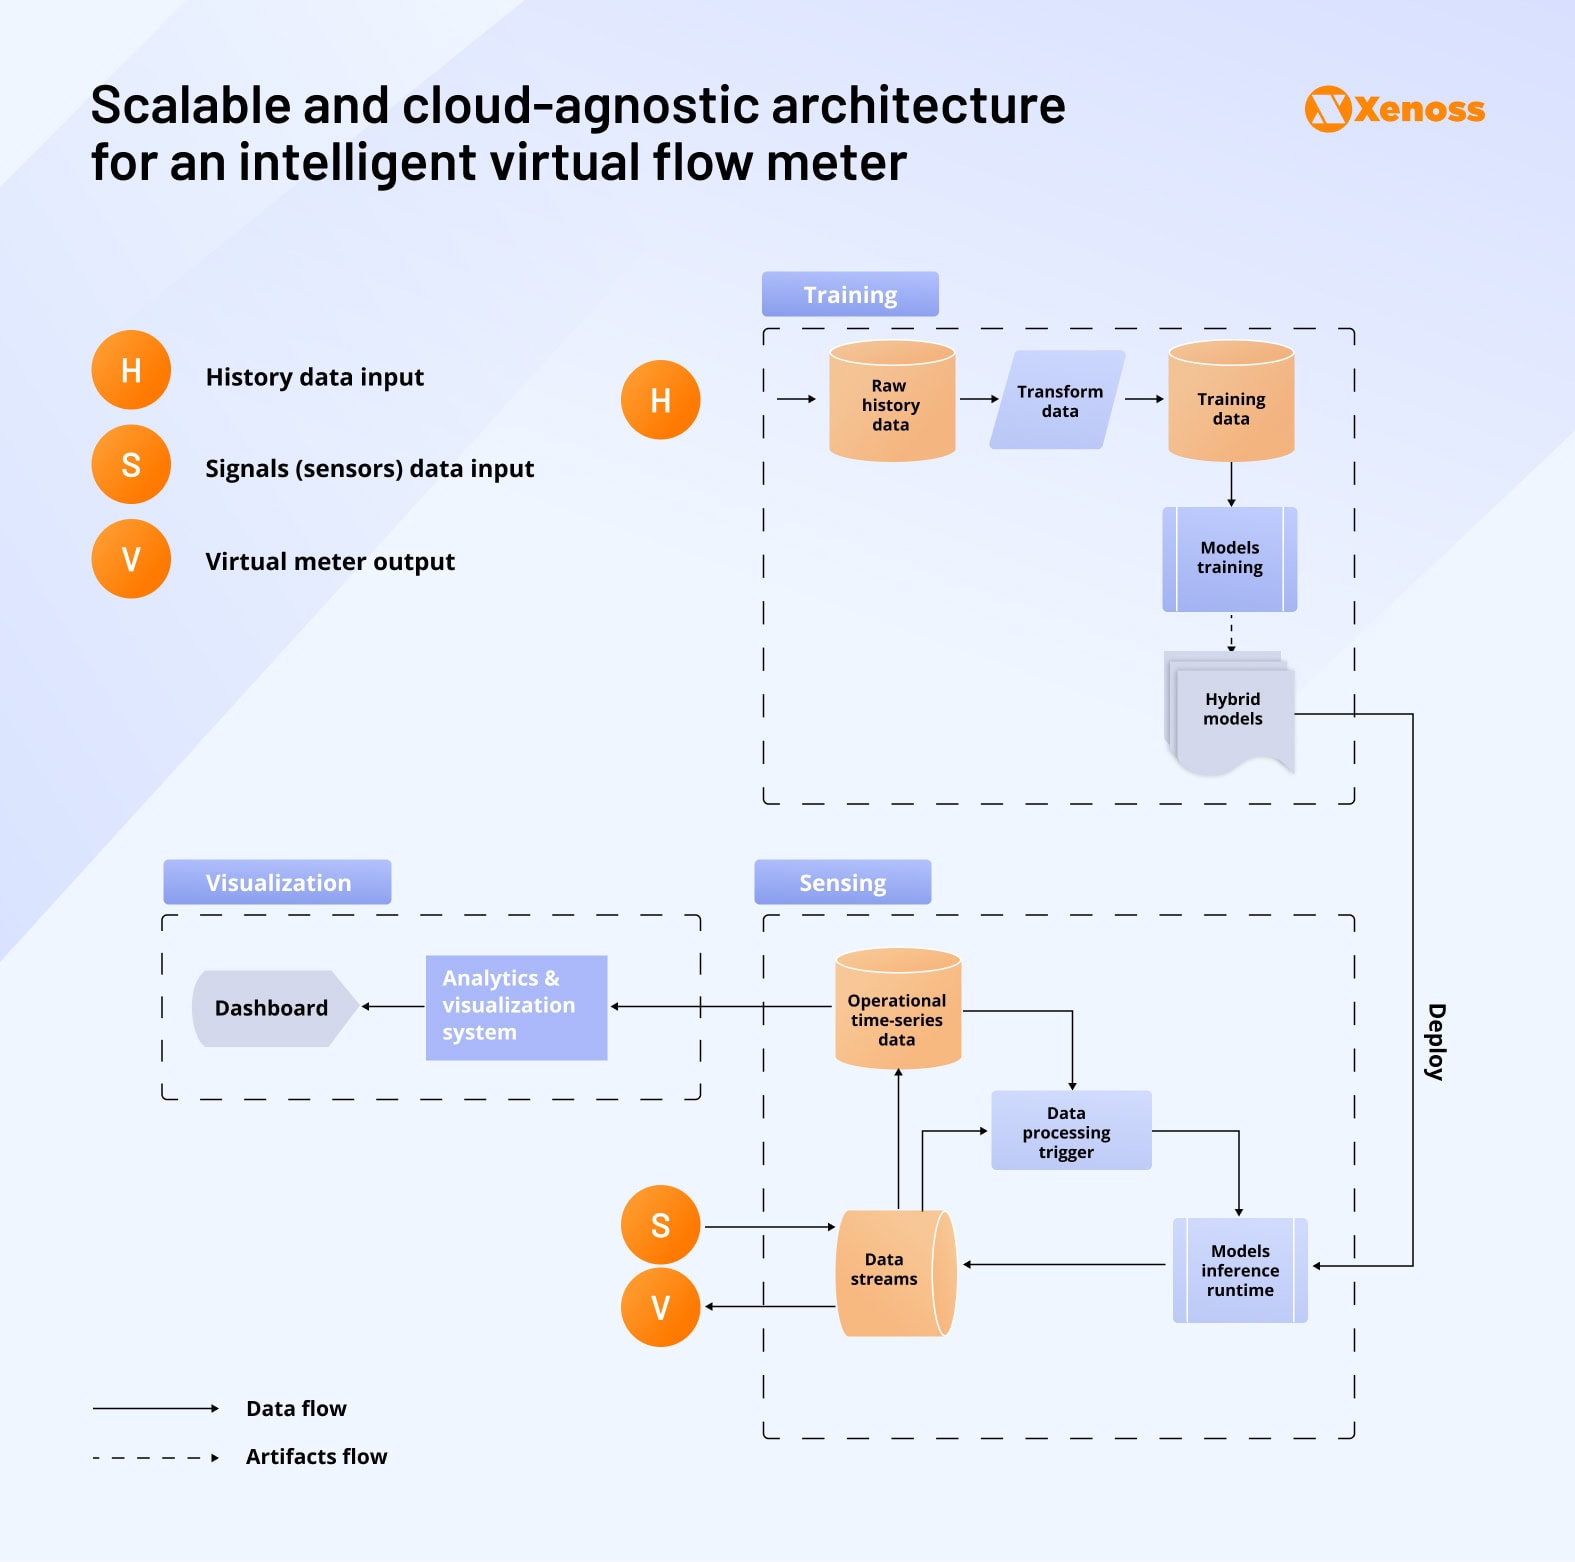
The hybrid approach combines physics-based accuracy with ML scalability through three integrated modules: training, sensing, and visualization.
Training module
Historical data is the bedrock for training both physics-based and ML models. It can be gathered and aggregated both in a cloud or on-premises data center, depending on the company’s needs and preferences. Some teams prefer collecting data on edge servers to keep it closer to the source.
The data processing and model training pipeline will comprise the following:
- Raw historical data storage and management
- Data preprocessing and feature engineering for model training
- Physics-informed ML model training on validated datasets
- Model testing, validation, and deployment workflows
Sensing module
The sensing component is a repository of real-time sensor data that is later transformed into flow measurements. It can be deployed both at on-site edge service and in the cloud via an on-premises data center.
This part of the solution has four moving parts.
- Model inference runtime: Low-latency prediction generation from live sensor feeds
- Data streaming: Real-time ingestion and preprocessing of multiphase sensor data
- Time-series storage: Operational data including wellhead pressure, tubing-head temperature, and choke positions
- Event triggers: Automated data processing activation based on sensor thresholds or time intervals
Visualization module
The ability to view flow rates, predicted flow, FLP, and THP helps to get a better prediction of well performance, so it is typically included in the architecture.
Depending on the team’s data analytics proficiency, visualization capabilities can be as simple as a tabular or chart-based dashboard or as complex as complex analytics systems with real-time alerts.
Data integration and synchronization challenges
Multi-well VFM deployments face critical data engineering challenges when processing sensor feeds from heterogeneous vendor systems across well groups.
The primary challenge stems from vendor heterogeneity—different connectivity protocols, data formats, and transmission frequencies across sensor manufacturers create infrastructure complexity. Network differences introduce latency variations that complicate real-time processing, while timestamp misalignment occurs when sensor data from multiple providers arrives with inconsistent temporal references, compromising synchronized analysis.
Xenoss engineers implement a temporal synchronization layer that addresses both latency and timestamp challenges. This architecture timestamps each data stream at the ingestion point, then buffers inputs using sliding windows sized to accommodate worst-case network lag. The VFM engine receives complete sensor datasets only when all required signals are present within the temporal window.
This approach enables the VFM to handle heterogeneous sensor latencies while maintaining calculation integrity and ensuring physics-based constraints are applied to temporally consistent datasets.
Machine learning model design for multiphase flow prediction
Large volumes of historical sensor data enable well monitoring teams to predict oil, water, and gas rates from pressure, temperature, vibration, and operational parameters. Machine learning excels at processing these datasets in ways that would be computationally prohibitive through traditional code or foundational physics formulas alone. ML-based predictions also capture granular day-to-day well performance fluctuations that thermodynamics-based calculations typically miss.
Six lift-specific algorithms for comprehensive flow prediction
Gas lift, natural flow, ESP, pneumatic pumps, and sucker rod systems each follow distinct flow equations, pressure profiles, and failure modes. Rather than building a single generalized model, the architecture employs six specialized algorithms for different lift types, enabling precise physics constraint embedding and targeted optimization based on well test results.
1. Gas lift model: Uses gradient boosting to predict multiphase flow from real-time pressure, temperature, and injection gas rate data, with parameters continuously updated from recent well test results.
2. Natural flow model: An LSTM network processes tubing-head pressure and temperature to forecast production rates while accounting for reservoir decline patterns through periodic retraining.
3. ESP model: Random forest algorithms ingest pump speed, intake pressure, motor current, and fluid properties to determine lift performance and phase-split rates.
4. Pneumatic pump model: Ensemble neural networks trained on cycle-time metrics and casing-tubing pressure differentials estimate flow while correcting for gas interference effects.
5-6. Sucker rod models: Two specialized algorithms convert polished-rod load and position data into pump efficiency and fluid rate forecasts, prioritizing recent stroke data to detect gas-fill events that affect pump performance.
Input and output data specifications
Each algorithm will make predictions based on a distinct lift-type-specific set of input data.
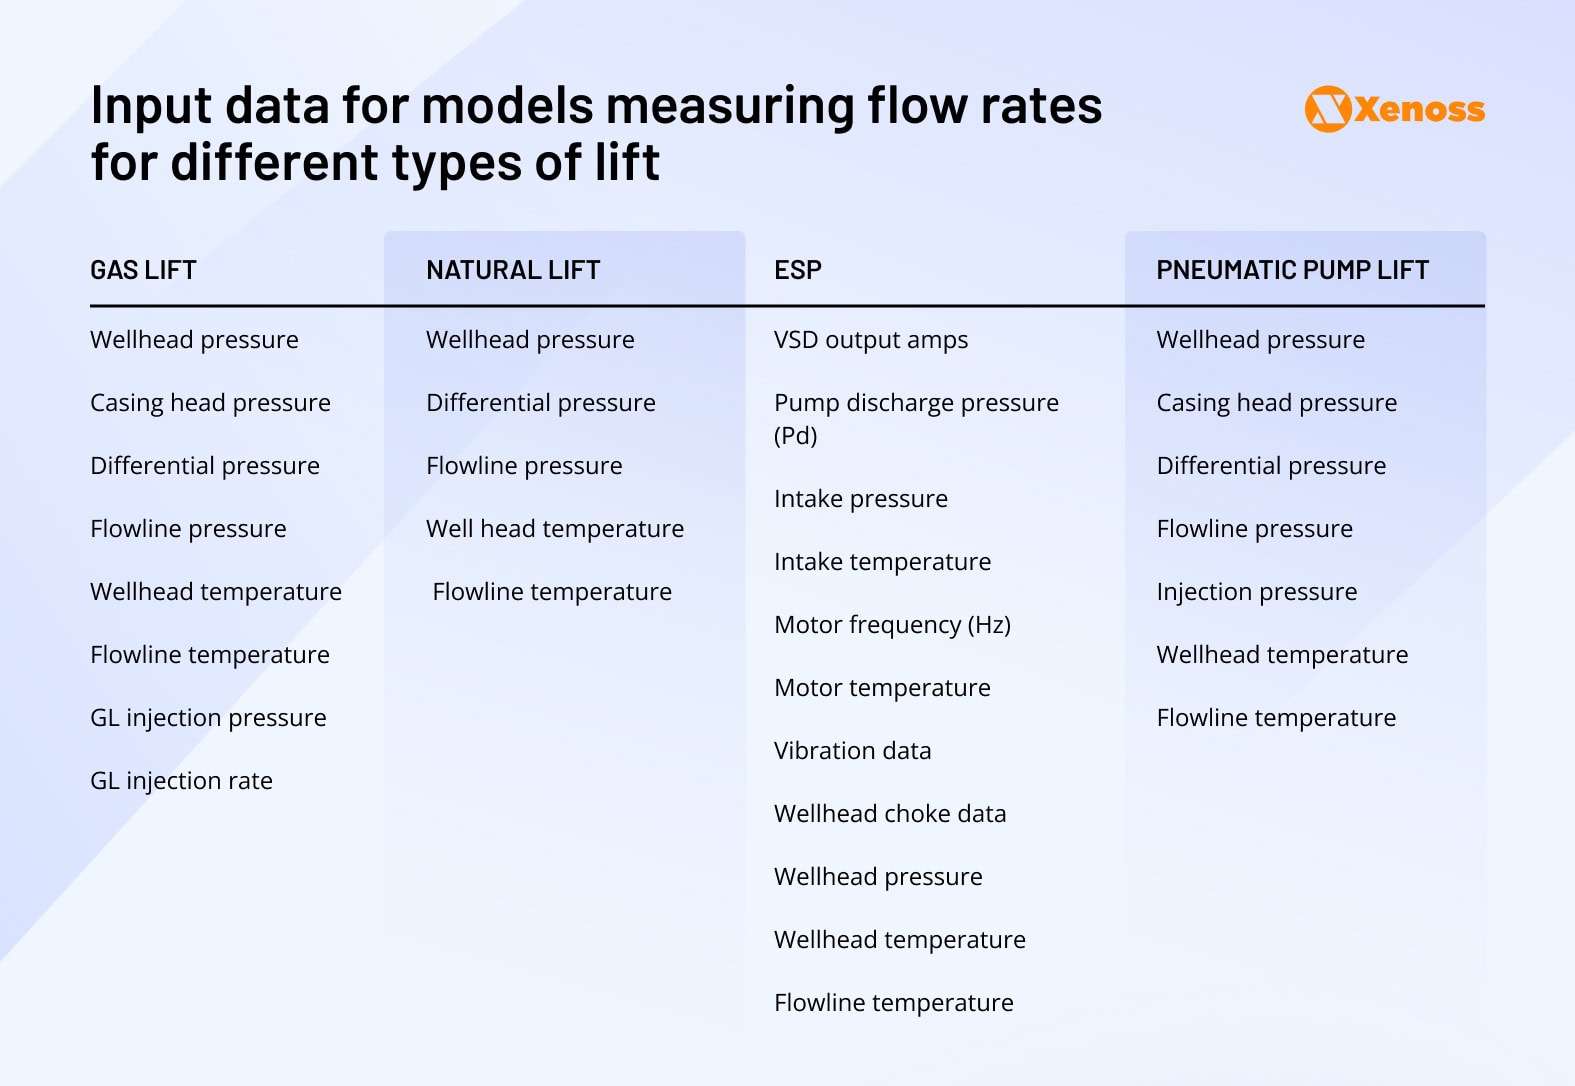
All models generate three floating-point predictions representing daily production rates:
Oil rate: Daily oil volume in barrels per day (bbl/d)
Water rate: Daily water volume in barrels per day (bbl/d)
Gas rate: Daily gas volume in standard cubic feet per day (scf/d) or thousand standard cubic feet per day (Mscf/d)
This consistent output format enables seamless integration across different lift types and facilitates portfolio-level production optimization and forecasting.
Virtual dynamometer card prediction for sucker rod systems
Well operators must continuously monitor rod-load vs. stroke curves to detect pump-off conditions, gas interference, fluid pounding, or plunger issues. Traditional physical dynamometers are bulky, expensive, and limited to short-duration well tests, creating operational blind spots.
Xenoss engineers developed virtual dynamometer capabilities that predict load curves from existing SCADA data streams—pressure, temperature, motor current, and stroke rate—eliminating the need for physical load cell installations. This approach provides continuous diagnostic capabilities and enables proactive intervention before equipment failures occur.
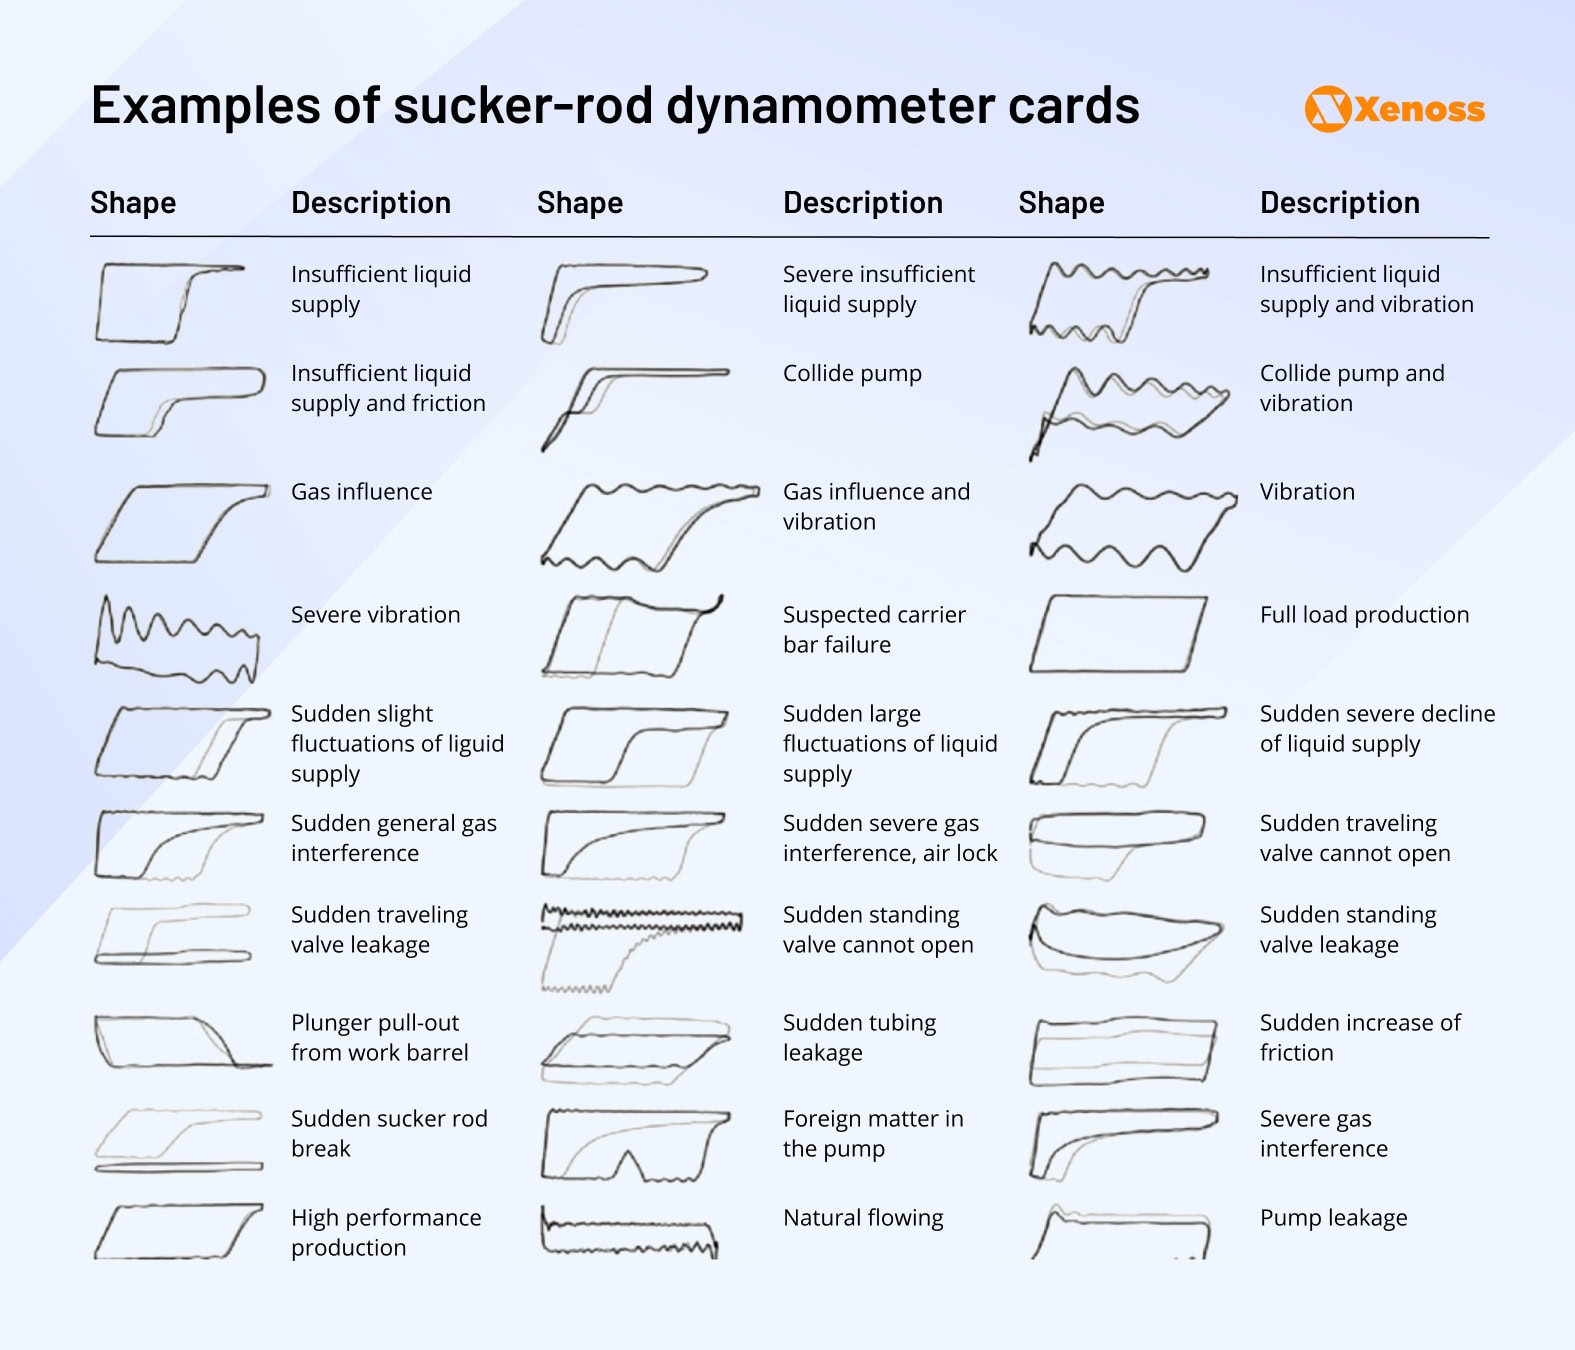
The virtual dynamometer models integrate diverse data sources, including well coordinates, daily production volumes, operational pressures, pump and rod specifications, completion details (pump depth, payzone depth, tubing specifications), surface unit parameters, electrical power consumption, fluid properties, and PVT characteristics. This comprehensive dataset enables accurate load curve reconstruction across varying operational conditions.
To balance diagnostic granularity with operational efficiency, the system employs two complementary prediction strategies:
1. Discrete point prediction model: A detailed view of the dynamometer card
The model returns a full load value of 128 equally spaced positions and reconstructs the entire dynamometer card shape.
For each stroke cycle, it records a sequence of load values, one per sample point, covering the entire upstroke and downstroke.
2. Parametric model: Lightweight analysis of critical points
The parametric model predicts only critical headline parameters, maximum and minimum rod loads, card area, pump fill, fluid load, etc., that operators already track on dashboards and use to set alarms, trend performance, and size equipment.
These compact outputs are easy to transmit, store, and map to established maintenance rules.
Model selection for heterogeneous sensor data
Virtual flow meter systems process heterogeneous data from multiple sensor vendors, creating challenges in data format and timing consistency. Despite vendor diversity, sensor outputs remain fundamentally tabular and structured, making them well-suited for specific machine learning approaches.
Xenoss engineers selected gradient-boosted tree algorithms as the foundation for VFM predictions based on their superior performance with structured data. Internal benchmarking demonstrated that gradient-boosting models significantly outperform neural networks for tabular sensor data, particularly in handling missing values, mixed data types, and non-linear relationships common in well operations.
The architecture leverages three proven gradient-boosting frameworks: XGBoost for high-performance prediction accuracy, CatBoost for robust categorical feature handling, and LightGBM for memory-efficient processing of large sensor datasets. This multi-algorithm approach enables model selection optimization based on specific well characteristics and operational requirements.
Building a physics-based flow meter
Where machine learning models identify patterns in observable measurements, physics-based simulations ground predictions in fundamental principles of fluid dynamics, this traditional modeling approach delivers high accuracy with proven reliability, making physics integration essential for robust VFM performance.
Data requirements for physics modeling
Physics-based models require a comprehensive characterization of the flow system.
Fluid characteristics, including phase compositions, pressure-volume-temperature relationships, and thermodynamic properties, form the foundation for accurate flow calculations.
Pipe geometry data—trajectory, inner diameter, and wall thickness—enables precise energy transfer and heat loss modeling between fluid and environment.
Environmental context significantly impacts model accuracy. Metaocean data, including ambient temperature, currents, and surface conditions, help quantify external heat transfer effects.
Equipment integration remains critical, as choke valves, pumps, and other flow control devices directly influence pressure-temperature profiles throughout the system.
Configuring sensor data
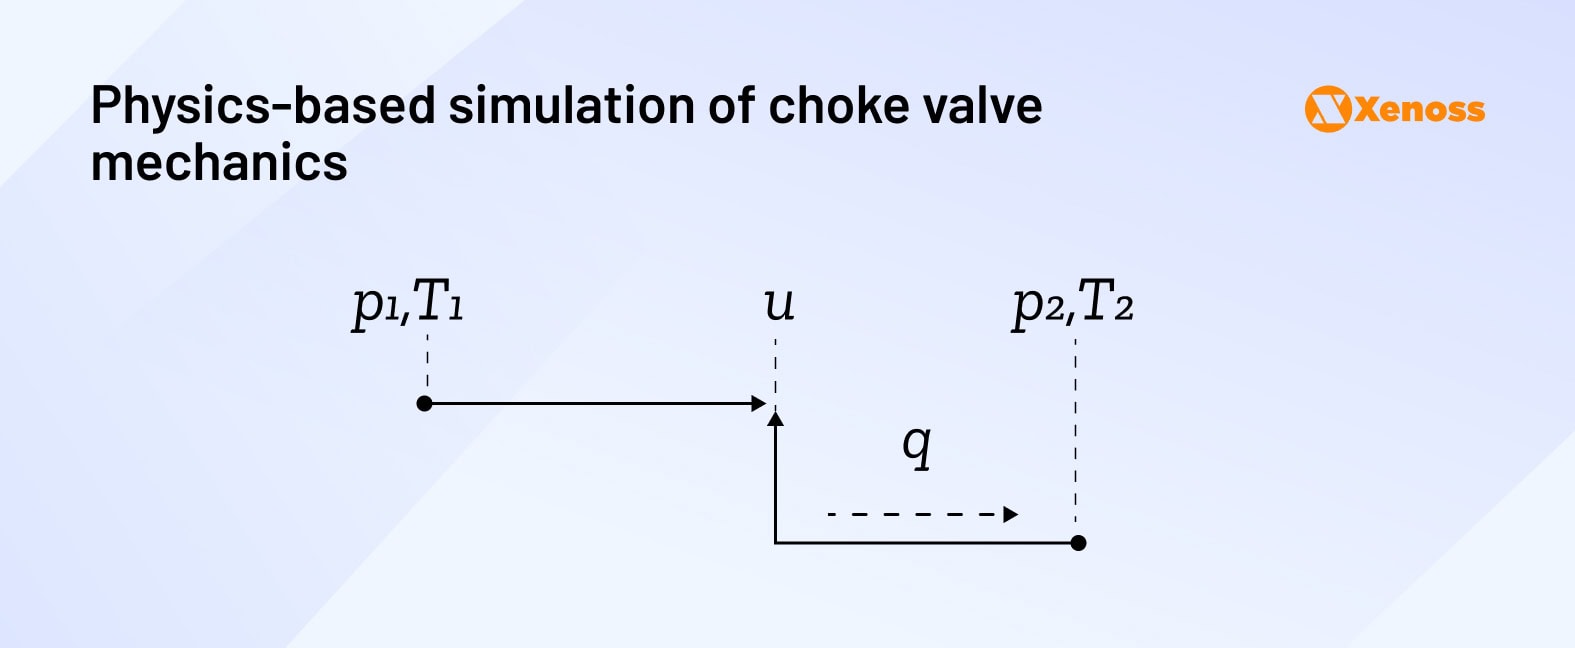
For physics-based simulations, engineers need to take stock of available sensors along the pipe. The real-time data they collect helps predict both boundary conditions and operational settings like choke opening.
In a hybrid VFM like ours, sensor data calculations are used to cross-check synthetic data generated by a machine-learning algorithm and fine-tune the accuracy of final predictions.
Calibrating the simulation
Because the underlying principles of fluid mechanics are centuries-old, the level of performance uncertainty tends to be lower for physics-based simulations compared to machine learning modeling.
Even so, it is reasonable to cross-check whether simulator outputs match reference data (e.g., historical flow rate measurements recorded by multi-phase flow meters).
Combining physics-based and ML-based modeling
Two primary approaches exist for combining physics and ML models. The first enhances physics simulations with ML-generated synthetic data, while the second incorporates physics outputs as engineered features for ML algorithms.
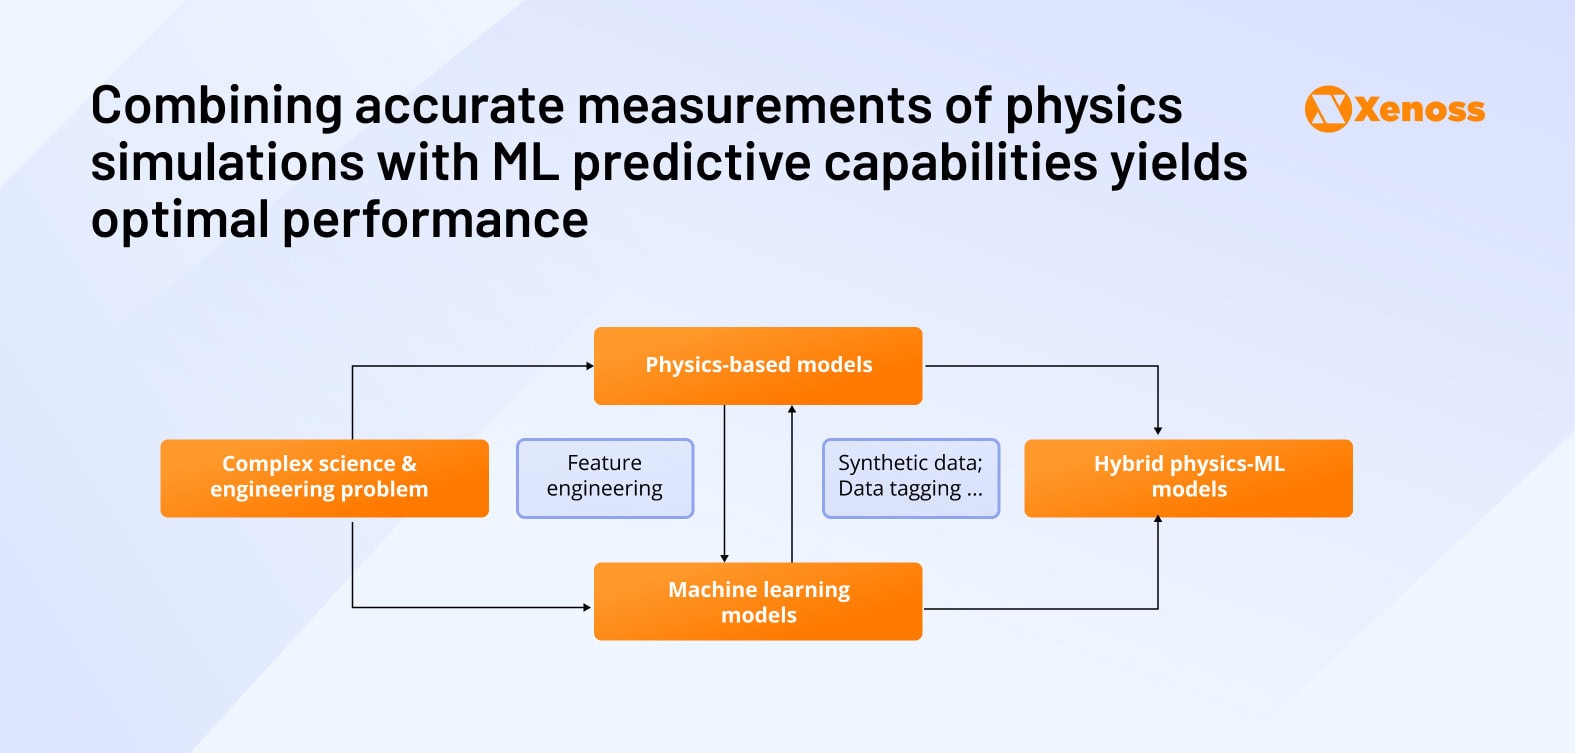
Xenoss engineers selected the physics-as-features approach because it provides dual validation: measurement compliance with fluid mechanics principles and ML performance optimization across data science metrics. This ensures both physical plausibility and predictive accuracy in final flow rate estimates.
Model adaptability across the well lifecycle and operational changes
Wells undergo significant operational changes throughout their lifecycle, such as workovers, lift method transitions, and natural aging that can impact flow behavior. Rather than requiring complete model retraining for each operational state change, Xenoss engineers designed the hybrid VFM to maintain accuracy across diverse well conditions through comprehensive training data representation.
The engineering approach focused on comprehensive well characterization by collecting data across diverse well portfolios, including vertical and horizontal configurations, various completion methods, different production zones, and multiple geographical locations. This dataset’s diversity was enhanced through detailed lifecycle documentation capturing well age progression, historical production decline curves, pressure-temperature evolution, and artificial lift system transitions.
Training on this comprehensive dataset enables the ML algorithms to learn how fundamental well characteristics influence flow behavior patterns. An aging gas-lift well in a mature field exhibits distinctly different pressure profiles and production patterns compared to a newly completed horizontal well with ESP systems. By capturing these operational variations in the training data, the hybrid model develops robust feature relationships that remain valid across operational transitions.
This approach eliminates the need for frequent model retraining while maintaining prediction accuracy as wells evolve through different operational phases and equipment configurations.
Metrics to evaluate VFM performance
Goodhart’s Law warns that “when a measure becomes a target, it ceases to be a good measure.” Optimizing excessive performance metrics can compromise the accuracy and practical utility of flow predictions. Engineering teams typically select 3-4 primary metrics that provide comprehensive model evaluation during training and operational deployment.
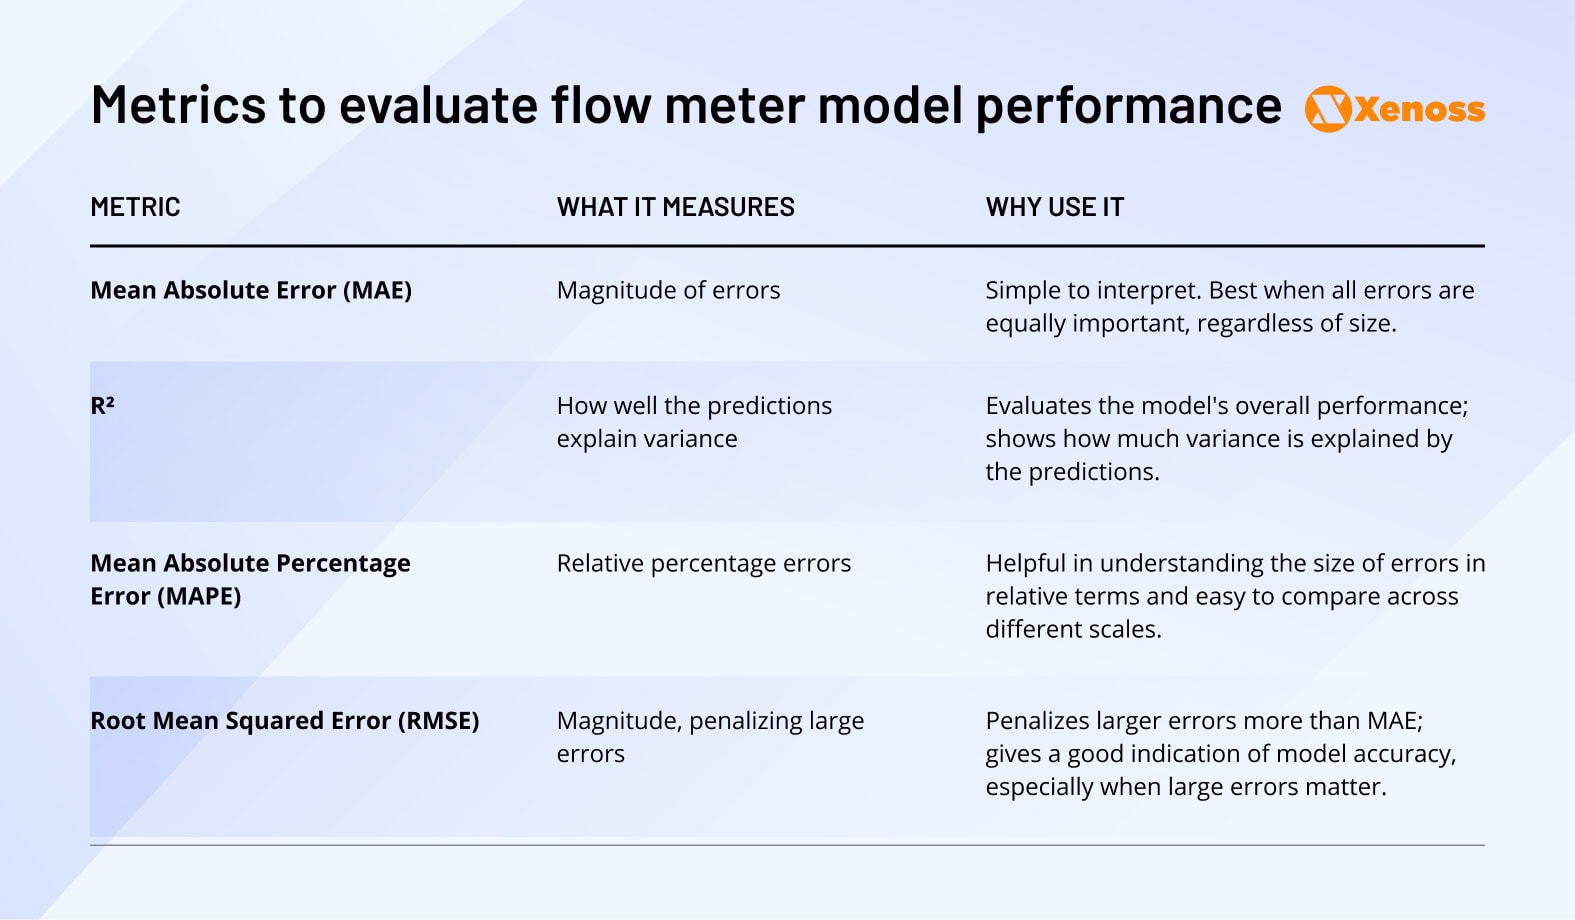
Xenoss engineers chose four benchmarks to assess VFM performance.
- Mean Absolute Error (MAE)
- R2
- Mean Absolute Percentage Error (MAPE)
- Root Mean Squared Error (RMSE).
The image below recaps the objectives and benefits of using these specific metrics.
Deployment architectures for operational flexibility
The hybrid VFM achieves sub-second inference times using CPU-only processing, eliminating GPU requirements and enabling flexible deployment across cloud and edge environments. This computational efficiency supports diverse operational scenarios from centralized analytics to real-time field processing.
Cloud-based deployment
Cloud deployment centralizes both sensing pipelines and visualization dashboards within a managed infrastructure. Real-time sensor data flows through MQTT-enabled IoT ingestion services, while historical datasets integrate via object storage or API gateways. This architecture suits demonstration environments, model calibration workflows, and operations lacking established real-time data acquisition systems.
Managed edge runtime deployment
Field devices running orchestrated edge platforms enable local processing of high-frequency sensor streams while maintaining centralized fleet management capabilities. MQTT-based local data feeds supply sensing algorithms, with optional co-located visualization modules for on-site monitoring. This approach balances real-time processing requirements with centralized analytics integration and over-the-air update capabilities.
Containerized edge solutions
Docker-compliant containerization enables standardized deployment across diverse edge hardware. The minimal deployment unit consists of containerized models exposing standardized interfaces for integration with existing edge infrastructure. This approach suits environments with container orchestration capabilities and standardized deployment workflows.
Native edge deployment
Legacy or constrained edge devices receive VFM capabilities through native binaries tailored to specific operating systems and software stacks. Minimal deployments combine model artifacts with command-line interfaces for basic execution and data exchange, supporting environments without containerization or managed runtime capabilities.
Continuous monitoring and maintenance framework
Proactive performance monitoring enables early detection of model degradation and maintains prediction reliability throughout operational deployment. Establishing maintenance protocols during the design phase ensures accountability and consistent VFM performance across diverse well conditions.
Xenoss engineers implement a comprehensive monitoring workflow that combines automated performance tracking with scheduled maintenance cycles. Performance reporting occurs monthly or in real-time when required, summarizing accuracy metrics across all predicted phases—oil, water, and gas rates—with detailed variance analysis and trend identification.
Automated dashboard systems provide continuous trend visualization, highlighting performance changes over time and triggering stakeholder notifications when deviations exceed operational thresholds. Real-time alerting mechanisms detect substantial prediction errors or systematic biases, automatically initiating system reviews and generating prioritized corrective action recommendations.
Scheduled model retraining occurs quarterly or semi-annually, incorporating recent operational data, evolving reservoir behavior patterns, and equipment configuration changes. This proactive approach maintains prediction accuracy as well conditions evolve while minimizing operational disruption through planned maintenance windows.
The framework balances automated monitoring efficiency with human oversight, ensuring model reliability while reducing manual intervention requirements for routine maintenance tasks.
Bottom line
Physics-based and machine learning approaches to flow measurement deliver complementary strengths that address different operational challenges. Physics-based models provide fundamental accuracy grounded in proven fluid dynamics principles, while machine learning algorithms excel at pattern recognition and adaptation to complex operational variations.
Rather than selecting between these approaches, successful VFM implementation requires strategic integration that leverages physics accuracy with ML predictive capabilities. Hybrid architectures deliver operational flexibility through multiple deployment options, from cloud-based analytics to edge processing, while maintaining prediction accuracy across diverse well conditions and equipment configurations.
This integrated approach positions hybrid VFM systems as cost-effective alternatives to traditional MPFMs, offering reduced operational costs, improved scalability, and enhanced reliability for comprehensive well portfolio management.