In Part 1 of our series on entropy in machine learning, we covered the definition of entropy in data science and its impact on the business value of AI models.
While it is primarily a technical concept used by AI engineers, business leaders should understand how high uncertainty in a dataset impacts prediction accuracy and results in unreliable insights.
In the second blog post on the topic, we focus on the most widely used application of entropy in machine learning: pruning decision trees and how decision trees use entropy and information gain to improve prediction accuracy. In Part 3, we will define other metrics that machine learning engineers use to measure uncertainty in datasets.
What we are covering:
- Definition of decision trees
- How decision trees split data and what makes a good (or bad) split
- How entropy is used to choose better splits
What is a decision tree?
A decision tree is one of the classification tools that machine learning engineers use to make decisions about a dataset.
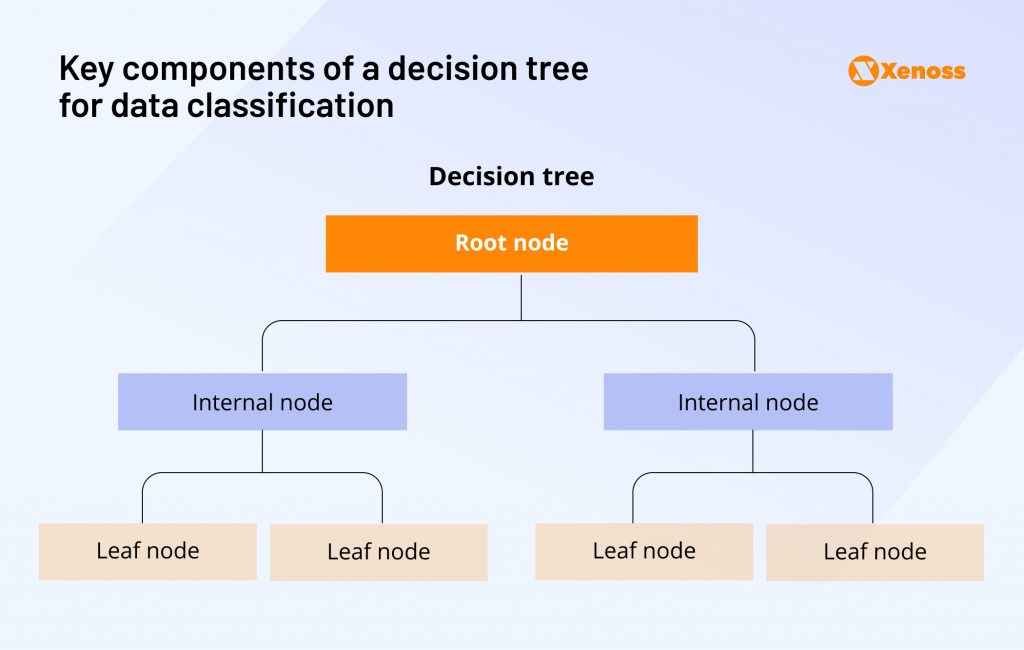
It typically has three key components.
- Root node: The starting question relevant to the entire dataset
- Internal nodes: Increasingly granular predictions about portions of the dataset Branches, connections between the root node and internal nodes
- Leaf nodes: Terminal decision tree nodes representing the final prediction outcome.
Here’s a visual representation of how these building blocks fit together.
The split of the dataset at each branch based on its compatibility with the feature an ML engineer requests is the key process by which data is classified.
How does a decision tree split data?
A decision tree splits data in three steps.
- Each “node” tests a feature in a dataset. (“Is the individual income over $60,000/yr?”)
- At the branch level, likely outcomes are identified (“Yes”/”No”)
- At terminal nodes, the result of the prediction is presented (“Approved loan”/”Denied loan”).
What makes a good split: If the tree splits in a way that groups together mostly similar outcomes (for example, one group containing almost all “positive” labels and the other containing almost all “negative” labels), then each subgroup is more “pure,” and it is easier to predict the outcome within that subgroup.
What makes a bad split: A poor split might mix the different outcomes so that neither subgroup separates “positive” from “negative.” A decision tree that splits poorly will struggle to classify any new data it encounters neatly, and child nodes will also inherit the confusion within the parent node. Thus, the final prediction will be less accurate.
How entropy is used to select better decision tree splits
Machine learning engineers calculate entropy to choose splits that generate two data subsets with lower entropy.
If a split successfully reduces the uncertainty within a subclass, it creates information gain.
Choosing low-entropy splits thus helps machine learning teams improve the quality of final predictions.
When a decision tree considers a potential split, it asks: “If I split the data this way, do I get subgroups with lower entropy?”
ML engineering teams would then select the splits with the highest entropy reduction.
A practical example of using entropy to select decision tree splits
To illustrate how machine learning engineers use entropy when training decision trees, we turned to a relatively ubiquitous example: Estimating the probability of default based on a borrower’s payment history and salary.
A similar classification algorithm is often used in real-world credit scoring systems.
Key idea
Imagine you have a small dataset of 10 loan applicants. Each applicant has:
- A Salary level.
- A record of Payment History (e.g., “Good,” “Late,” or “Poor”).
- A known outcome: Did they default? (Yes or No).
Here is a simplified version of the dataset.
| ID | Salary | Payment history | Default? |
| 1 | $50,000 | Good | No |
| 2 | $35,000 | Good | No |
| 3 | $20,000 | Late | Yes |
| 4 | $45,000 | Late | No |
| 5 | $18,000 | Late | Yes |
| 6 | $32,000 | Good | No |
| 7 | $60,000 | Poor | Yes |
| 8 | $80,000 | Good | No |
| 9 | $22,000 | Good | Yes |
| 10 | $38,000 | Poor | Yes |
In total, we have 6 “No” (No Default) and 4 “Yes” (Default).
Examining possible splits
The decision tree tries to decide: “Which feature should I split on first?” It might consider splitting on Salary or Payment history (among other features).
Let’s look at how each candidate’s split divides the data:
Split A: Salary > $40,000?
Group 1 (Salary > $40,000): 4 borrowers fit the category
- Question: Did borrowers with salaries over $40k default?
- Outcomes: 3 “No”, 1 “Yes”
Group 2 (Salary ≤ $40,000): 6 borrowers fit the category
- Question: Did borrowers with salaries under $40k default?
- Outcomes: 2 “No” and 4 “Yes.”
Split B: Payment history = “Good” vs. “Not good”
Let’s group “Late” and “Poor” together as “Not good”.
Group 1 (Good): 5 borrowers fit the categories
- Question: Did borrowers with a good credit history default?
- Outcomes: 4 “No”, 1 “Yes”
Group 2 (Not good): 5 borrowers fit the category
- Question: Did borrowers with a not-good credit history default?
- Outcomes: 4 “No”, 1 “Yes”
Using entropy to evaluate the quality of splits
Now, let’s calculate the entropy for both splits and identify the one with the highest uncertainty reduction.
First, let’s compare the subsets both splits generate.
Split A (Salary > $40,000)
- Group 1: 3 “No,” 1 “Yes” ⇒ mostly “No” but still has 1 “Yes.”
- Group 2: 2 “No,” 4 “Yes” ⇒ more “Yes” but still mixed (2 “No” out of 6)
One subgroup is leaning “No,” and the other is leaning “Yes,” but neither is highly pure. Overall, we’ve gained some clarity, but each subgroup still has a noticeable mix.
Split B (Payment history = “Good”)
- Group 1: 4 “No,” 1 “Yes” ⇒ mostly “No,” fairly pure.
- Group 2: 1 “No,” 4 “Yes” ⇒ mostly “Yes,” also reasonably pure.
In the “Payment History” split, each subgroup is strongly skewed in one direction. That means each group has lower entropy; it’s less mixed and more predictable.
Because Split B (based on Payment History) produces two subgroups that are more clearly separated into “Yes” and “No,” it results in a more significant drop in entropy overall.
In other words, it yields a more orderly (less confused) data division.
A decision tree algorithm will likely choose Split B first because it provides a more distinct separation between defaulters and non-defaulters.
After that, each subgroup might be further split (e.g., by salary range or some other feature) to achieve even purer nodes.
Bottom line
Decision trees are a powerful classification technique, but it’s essential to make sure the split of a dataset into subsets is as neat as possible. If the distinction between two subsets is unclear, the uncertainty of the final prediction increases, leading to poorer model performance.
Entropy allows machine learning engineers to evaluate the purity of the subsets generated by a tree split and improve the confidence of a tree’s decisions.
While entropy remains a valuable data science metric, programmers can use other tools to assess the’ accuracy and reduce the training process’s computational strain.
In Part 3, we look at other entropy-related concepts and a computationally superior alternative to entropy: the Gini index.